Leveling the Playing Field for All Athletes
After years of coaching, I’ve seen countless athletes struggle with their erg scores, feeling they don’t measure up to their potential. This is especially true for smaller rowers who find themselves comparing their results to the 120kg powerhouses sitting in the middle of the boat. This comparison often leads to discouragement and diminished enthusiasm for erging – a crucial part of developing power and fitness.
To address this issue, I’ve created a comprehensive spreadsheet that accounts for two major variables that impact rowing performance: weight and age.
How It Works
The tool builds upon Concept2’s weight adjustment formula but takes it a step further by incorporating age factors. I’ve aligned the age categories with standard World Rowing Masters age groups for practical application across the rowing community.
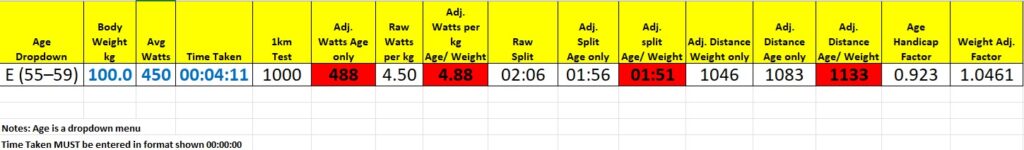
To use the spreadsheet, you must input several key variables:
- Complete a 1km test on a Concept2 ergometer
- Select your age group using the dropdown menu
- Enter your weight in kilograms
- Input your average watts (taken directly from your Concept2 monitor) for the 1km test
- Enter the time taken to complete the 1km in hrs:mm:ss format with colons
Once these variables are input, the spreadsheet automatically performs all calculations, providing you with adjusted scores that account for both age and weight factors.
While the age categories remain identical for both men and women, the handicap calculations differ between sexes for racing. This difference with the approach I have taken is that it reflects the natural variations in VO2 max deterioration curves between males and females (roughly the same) – a scientifically-backed approach also referenced by FISA in their handicapping systems.
The Science Behind It
Though no formula can be absolutely perfect, this spreadsheet provides as close to an even testing platform as possible. It allows coaches and athletes to:
- Track individual progress more accurately
- Compare performances across different weight classes
- Account for age-related physiological changes
- Recognize the value that older and lighter athletes bring to the team
Watts per Kilo: Bridging Rowing and Cycling
I’ve also incorporated the watts per kilogram metric into the spreadsheet. While not traditionally emphasised in rowing, this metric is a cornerstone of performance measurement in cycling. Given the significant physiological and technical overlaps between rowing and cycling – both being power-endurance sports that rely heavily on aerobic capacity and muscular strength – this additional metric provides valuable comparative insights.
The watts per kilo statistic offers another dimension for performance analysis, allowing athletes to understand their power output relative to body weight. This is particularly useful for:
- Comparing power efficiency across different weight athletes
- Tracking improvements in power-to-weight ratio over time
- Providing another objective measure beyond raw scores
Now you can focus on what really matters – improving your personal scores and celebrating genuine progress rather than comparing yourself to athletes with entirely different physical attributes.
Download the spreadsheet below – NOTE, DO NOT change any data in any other cells apart from the Blue ones.
0 Comments